|
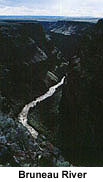
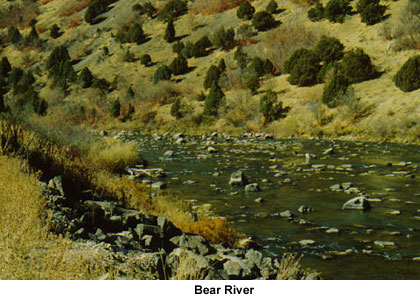
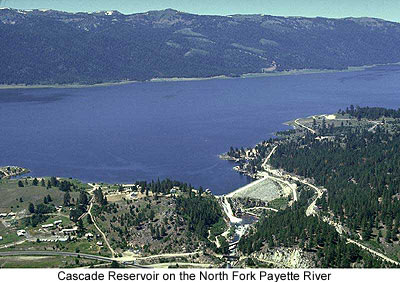
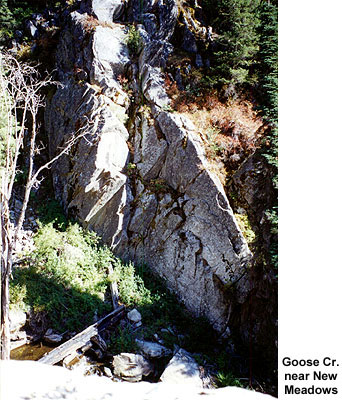
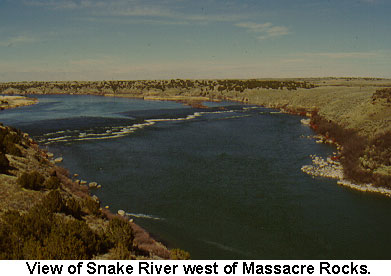
Look
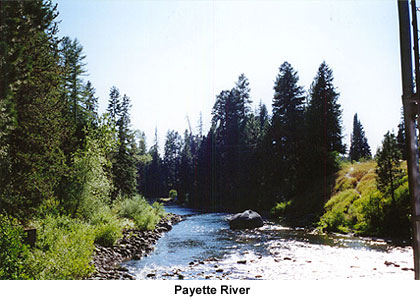
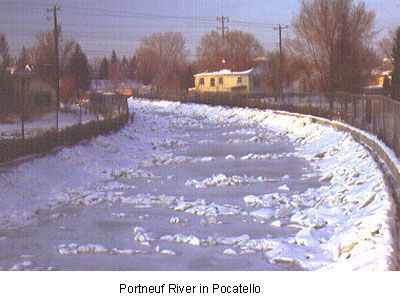
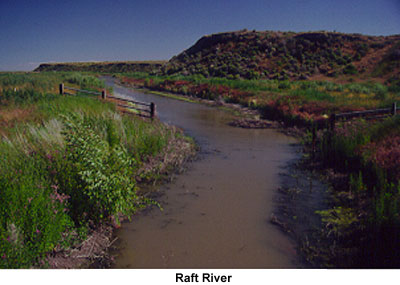
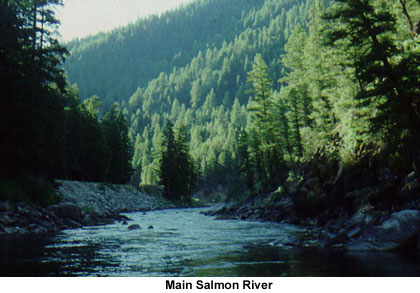
at some water pictures: |
 |
|
Click
here to
learn more
about running water |
|
GO
TO HUC to review
Idaho's drainage patterns. |
Streamflow (Q) is calculated by multiplying the velocity (V) of the water in a stream times the area (A) of the cross section:
Q=V*A
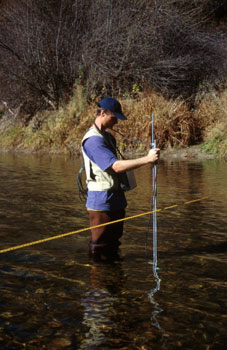
The area is simply the width (W) of the river times the depth (Y). Because depth and velocity change through any cross section (it’s faster and deeper in the center of the river), several measurements must be made. Typically, the stream gauger splits the stream into several cells and measures W, Y, and V in each cell, calculates Q in each cell, then adds up all the cells to get the total Q. The United States Geological Survey recommends 20 cells in a cross section.
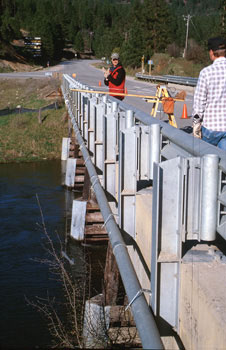
The stream gauger moves across the river measuring the distance from the bank to keep track of width, and takes a depth measurement at a station. A salmon swimming upstream could tell you that the stream velocity is slower at the bottom of the river than at the top. How then do we report the velocity in a cell if it changes? Fortunately, the relationships between depth and velocity are fairly well known. The average velocity typically occurs at 60% of the depth measured from the top. So we measure the depth, then place a current meter at 0.6 times the depth to get the average velocity for that station. If the stream is shallow, the gauger will wade. More elaborate suspension systems, boats or bridges are required in deep and fast flow. Here is an example of calculating discharge from field data.
Continuous
Streamflow Measurement
The above techniques give us the discharge of a stream only at the time of
measurement. Does this mean that every time the river rises from a rainfall
that we have to re-measure the streamflow? Yes and no. We can construct a
continuous record of streamflow, called a hydrograph, from what is called
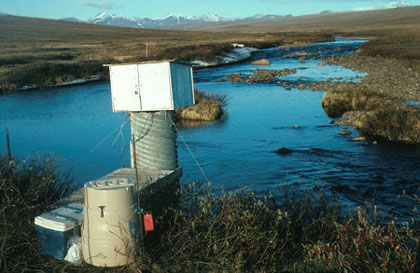
a stage-discharge relationship. Stage is simply the height of the water surface
relative to the height of a reference marker that doesn’t change. Stage
is measured with a staff gage. The simplest staff gage is essentially a meter
stick placed in the stream. When a stream gauger measures discharge, he/she
records the stage. Stage is continuously monitored by charting the history
of a float in a stilling well.
The float moves up and down with the water level and rotates a drum on which
a sheet of paper is attached. At the same time, a pen moves across the drum
at a known rate. The result is a line describing the stage history. Fortunately,
for any given stage in a cross section that is not altered by erosion, the
discharge is always the same. Discharge is measured at several stages, then
a relationship is established between stage and discharge through a mathematical
equation. If stage is continuously monitored, continuous discharge can be
calculated by the stage-discharge relationship.
Streamflow
Hydrograph
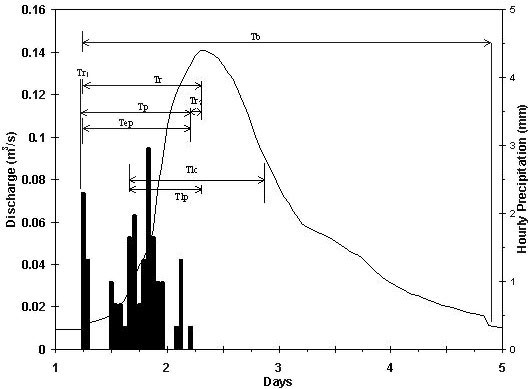
A hydrograph
is a plot of discharge against time. The time scale can be in hours, days,
months, or even years. The rise and fall of discharge is the response of the
watershed to inputs of precipitation. A simple storm hydrograph contains 4
components: baseflow, the rising limb, the crest, and the falling limb. The
arrangement of these 4 components produce a unique shape of a hydrograph that
results from a combination of properties of the storm and the watershed. For
example, a hard rain on pavement will result in a very steep rising limb,
and a watershed containing wetlands will usually produce hydrographs with
long falling limbs as the wetlands slowly release water.
Precipitation
Measurement
Precipitation
is reported as a depth of water in inches, and includes rain and snow. The
depth does not include the actual depth of snow, but is the depth of water
that would result from melting the snow. Rainfall is measured in rain gauges
which are essentially buckets that collect water. If you record the change
in depth in the bucket with time you get a rainfall rate or intensity. A bar-chart
of precipitation that falls in a given unit of time is called a hyetograph.
Comparing a hyetograph to a hydrograph allows you to investigate how quickly
streams respond to precipitation.
Supplemental Material:
Chapter 8 of Rocks, Rails and Trails
The field guides below are a part of the Guidebook to the Geology of Eastern Idaho:
*Fluvial Terraces along the Middle Fork Salmon River, Idaho, andtheir Relation to Glaciation, Landslide Dams, and Incision Rates
*Late Quaternary History of the Beaverhead Canyon, Southwestern Montana.
For more information found on the web, visit our hydrology web link page.