 EXAMPLE
2: RIVER DEPLETION RESPONSE
 When
an aquifer is pumped, ground water levels in the vicinity of the well decline,
creating a cone of depression around the well. This cone of depression is
the response of the system (the aquifer) to the pumping that has been introduced
(see illustration right). Aquifer drawdown varies with distance from the
well; consequently, the system response is location-dependent. The longer
the well is pumped, the greater the drawdown becomes, making the system response
time-dependent as well. If we select a specific location within the cone
of depression, and by field measurements or theoretical means we quantify how
drawdown varies with time in response to pumping, we have developed a simple response
function for that particular location and well. In most cases, the drawdown
will be proportional to the discharge of the well, so our response function, if
expressed as a ratio of drawdown to well discharge, can be used to predict the
system response to any pumping rate. Cones of depression from multiple pumping
wells normally can be superimposed, assuming that the system response is independent
of other events occurring simultaneously. These are the basic concepts of
a response function.
Response functions are a means by which we can express cause and effect relationships for an aquifer or a river-aquifer system. The functions may be thought of as a series of values or ratios that express the response at a specific location to aquifer recharge or discharge at another location. Since the response changes with time, a different value is required not only for each pair of locations, but also for each time period of interest. The following two examples illustrate the concept of response functions for a) drawdown in an aquifer, and b) for depletion of a stream.
EXAMPLE
1: AQUIFER DRAWDOWN RESPONSE
Let's assume
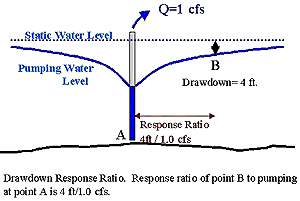
that we have two wells, A and B which are 1000 feet apart (see illustration
above). We measure water levels in both wells and start pumping well A
at a rate of 1.0 cubic foot per second. After 1 hour, we measure the water
level in well B and note that the water level is 4 feet deeper than before we
started pumping well A. The reponse ratio expressing the response of the
aquifer at point B to pumping at point A would be the ratio of the drawdown
at point B (4.0 feet) to the pumping rate (1cfs) at point A. In this example,
the ratio 4 ft./1.0 cfs expresses the effects from pumping at one location on
water levels in the aquifer at another location. It is assumed that the
ratio at location B holds regardless of the pumping rate at location A (see
section on assumptions). Consequently, if the pumping rate were doubled
to 2 cfs, the drawdown would double to 8 feet. It must also be noted that
the drawdown increases as the pumping time increases. For example, say
that we continue pumping at 1 cfs and measure water levels in well B that were
6, 8 and 10 feet deeper at 2, 4 and 10 hours after we began pumping at well
A, respectively. There must, therefore, be a different response ratio
for each time period of interest. After one day of pumping, the ratio
may have increased to 15 ft./1.0 cfs. The term response function is used
to represent the series of ratios describing responses at different times.
In addition to describing the response of water levels in an aquifer to ground water pumping, response functions may be used to describe the effect of ground water pumping (or recharge) on surface water resources. When surface water resources are in hydraulic connection with an aquifer, ground water pumping or recharge can affect lake levels or flows in springs and streams (see Surface Water/Ground Water Interactions). An example of a response function for a stream-aquifer system follows.
 EXAMPLE
2: RIVER DEPLETION RESPONSE
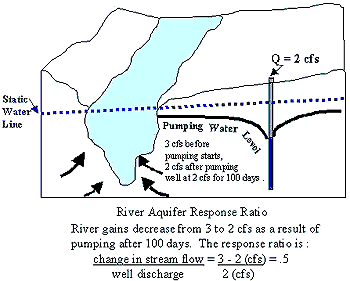
Let's assume that we have a stream that traverses a plain and is in hydraulic connection with an underlying aquifer (see figure at left). That stream (a gaining stream) is being fed by the aquifer at a rate of 3 cubic feet per second (cfs) in our reach of interest between two gaging stations. A new well installation in the aquifer begins continuous pumping at a rate of 2 cfs. After 100 days of pumping, the stream is now only gaining 2 cfs rather than the 3 cfs it used to gain in this reach. The stream flow in this reach has therefore been depleted by one cfs after 100 days of pumping. The response ratio representing this pumping location to this river reach at 100 days is calculated as the ratio of the depletion (1 cfs) to the pumping rate (2 cfs) or 0.5. This ratio will change over time. After 200 days, the ratio may increase to 0.6. The series of ratios representing responses of this river reach to pumping (or recharge) at this location, at different times, comprise the response function for this well and river reach. A different response function will exist for different river reaches and for different pumping locations.
It is assumed that the ratios determined between the pumping well and the river reach are valid for all pumping rates. Pumping from the well for 100 days at a rate of 4 cfs rather than 2 cfs would deplete the stream by 0.5 x 4 cfs or 2 cfs. This means the stream would be gaining 1 cfs rather than the 3 cfs gain that existed before pumping started. If the rate of depletion were to exceed the rate of river gain (3 cfs in this example) the reach would become a losing rather than gaining reach of the stream. In this case, the ratio would hold only as long as 1) the river stays in hydraulic conection with the aquifer (the reach does not become perched) and 2) there is enough water flowing in the river to meet the loss (the river does not go dry).
Although response functions can be developed to represent the drawdown response of an aquifer as in the first example, this description is focusing on ground water and surface water interactions and, therefore, on stream-aquifer response functions as illustrated in the second example.
The stream depletion response to continuous aquifer pumping has been illustrated for the Eastern Snake River Plain aquifer by Johnson, and others (1993) and Hubbell, and others (1997). These descriptions portray the response of four reaches of the Snake River to ground water pumping at selected locations in the Snake River Plain aquifer. The response varies dramatically with location. Graphs of response in two river reaches to continuous pumping at five locations can be seen in the above figure. Although this example shows response functions as graphs of proportioned depletion (depletion rate/pumping rate) vs. time, the response functions could also have been expressed as a matrix of response ratios (for each time, pumping location, and river reach), or as equations representing depletion as a function of time and location.