Faults,
Thermal Waters & Seismicity
 Click here for Additional Earthquake Information and Activities! . |
Terms & Phrases
|
I. Geologic
Map of Idaho
A. The information in Figure 1 represents major groupings of rock types in Idaho at a relatively large scale. In this map, the variety of rock types that would be seen at a smaller scale is not evident because similar rock types have been grouped together into six broad categories:
-
Sedimentary
-
Metasedimentary
-
Mafic volcanic, igneous and metamorphic
-
Felsic igneous and metamorphic
-
Calcic-alkalic igneous and metamorphic
-
Unconsolidated sediments
At this coarse level of grouping, the map presents a very simplified view of Idaho's complex geology.
Visit the
Idaho Overview
Module Rocks,
if you
need to review rock
types and cycles.
Familiarize yourself with this map and the capabilities of Cadviewer by zooming in and panning about, and by turning different layers on and off (note that individual rock categories in this simplified map are non-transparent, so only one rock category at a time can be viewed).
A full GIS coverage of Idaho Geology is available on the Atlas. Click here to download this ArcView coverage. Be aware that this is a large file which can take some time to download, and that it is a .shp file in self-extracting ZIP format. (Click here for more information on ZIP files). ArcExplorer software is provided on the Atlas CD-ROM, and enables .shp files to be viewed, combined into custom maps, and printed. Click here for instructions on using ArcExplorer. Go to the Map Archive for additional information on installing ArcExplorer software and to access additional types and formats of GIS data.
The flexibility to create custom maps is one powerful feature of Geographic Information Systems (GIS). Create a view showing just counties and metasedimentary rocks; which county is underlain mostly by metasedimentary rocks?
Figure 2 is an example of how GIS data can be used to create custom maps; it shows the geographic distribution of mafic igneous and metamorphic rocks. Except for a band of small mafic intrusives in eastern Bonner and Boundary Counties, a small belt of metamorphosed mafic volcanic rocks at the westernmost edge of Idaho County, and scattered patches of mafic gneisses primarily in Valley and Idaho Counties, the map essentially shows the extent of mafic volcanic rocks across the state. What type of volcanic rock does this probably represent?
B. Geologic provinces represent a further level of generalization above that of the descriptive information on rock types shown in the geologic map of Figure 1. The boundaries of geologic provinces are based on physiography, predominant rock types, similar geologic history, and relative ages.
Figure 3 reproduces the simplified geologic map of Figure 1 together with the approximate boundaries of Idaho's geologic provinces. Turn off the geology and county layers to view the geologic provinces clearly. In southern Idaho, for example, the Snake River Plain Geologic Province is an arcuate structural trough filled with mafic volcanic lava flows. Note that not all of the mafic volcanic rocks shown in Figure 2 are part of this geologic province because of differences in age, geologic history, and geographic setting of the mafic rocks outside this area.
The western third of the Snake River Plain Geologic Province is mostly comprised of rocks other than mafic volcanic rocks. Because of such differences between its eastern and western portions, the Snake River Plain Geologic Province is often subdivided into a predominantly volcanic "Eastern Snake River Plain" and the predominantly sedimentary "Western Snake River Plain".
Text and 3-D graphics
of
the Snake River Plain
will be linked from this
spot during Phase 2
of the Digital Atlas.
II. Active
Faulting
in Idaho
Take a look at Figure 4 which is a map of most recently active faults in Idaho. Turn off the appropriate layers to clearly view just the Quaternary and Holocene faults. The Quaternary faults have been active since Pleistocene time. The Holocene faults have been active in the past 15,000 years and represent neotectonic crustal activity.
Exercise #1:
Active Faults
Use the information
in
Figure
4 to answer the
following questions:
1. By looking at the map of Quaternary faults, identify the geologic province with the greatest number of faults that have been active over the past 2 million years. Faults represent potential pathways for groundwater to circulate deep into the earth's crust; faults that have been active in the recent past indicate a potential for earthquakes to originate by future movement on these faults.
2. The map of Holocene faults shows only those faults which have been active in the past 15,000 years (based on historical records and geologic characteristics such as scarps, broken ground, and stratigraphic offsets seen in trenches). Identify the geologic province that has the most neotectonically active faults.
III. Geothermal Water
A. All geothermal waters originate as meteoric waters at the surface, by percolation of rain and snow meltwater into shallow aquifers and then into a geothermal aquifer. Geothermal heating is due to one or a combination of the following three factors:
i) groundwater can be heated during deep circulation through rocks that are hotter than normal due to the geothermal temperature gradient in the earth's crust. This temperature gradient normally means that rocks get about 1.5 - 2oC warmer per kilometer of depth, but can be substantially higher in volcanically and tectonically active areas;
ii) groundwater can be heated by exposure to magmatic heat sources in volcanically-active areas, such as occurs in Yellowstone Park;
iii) rocks rich in uranium, thorium, and/or potassium are heated by the energy liberated during radioactive decay of these elements, thereby providing a source of heat to ground water circulating through them.
B. Take a look at the maps of geothermal springs and thermal wells in Figure 5. Turn the various layers off or on so as to clearly view the locations of springs and wells across the state, and their locations relative to Idaho's geologic provinces.
Exercise
#2:
Thermal Waters &
Geologic Provinces
Using the information on these and preceding maps, answer the following:
1. Which of the following rocks tend to have more potassium: sandstone or carbonate? more uranium and thorium: felsic igneous rocks or mafic igneous rocks?
2. Which geologic province contains most of the thermal springs in Idaho?
3. Judging from the type of rocks occurring (Figure 1) in the geologic province identified in (2), which geothermal heating mechanism is likely responsible for creating these thermal springs?
4. From the dearth of volcanic rocks and the predominance of active faulting in the Basin and Range province of southeast Idaho, which one of the geothermal heating mechanisms represents the most likely explanation for the prevalence of warm springs in that region?
5. Note where most thermal wells occur in the state and relative to geologic province boundaries. Do you think their spatial location and density reflect the underlying geology and hydrology, alone, or could other factors affect where most of these wells occur (and where they don't occur)?
IV. Idaho Earthquakes
The following material is excerpted from Idaho Geological Survey reports and compilations of data, specifically Staff Report 95-2, Information Circular 56, and related information.
A. Earthquakes release energy in two different forms that travel through the earth differently, and which have different energies associated with them. Earthquake energy is measured by an instrument known as a seismograph which measures the back-and-forth and side-to-side motion of the earth's surface as seismic waves pass by. Seismic body waves move through rock in a compression - relaxation mode, analogous to sound waves traveling through air. These waves travel fastest through rock. Earthquake magnitude determined from measurement of body wave motion (MB) is based on the maximum observed ratio of wave amplitude to period for body waves arriving in the first 5 seconds of a record (U.S. Geological Survey practice).
Seismic surface wave energy is carried in a side-to-side motion and arrives slightly later than body waves. Large earthquakes tend to generate more surface wave amplitude relative to body wave amplitude. The opposite is true for small events. Thus, earthquake magnitude determined from surface wave energy (MS) is dependent on the amount of total energy released at the source or epicenter.
Local magnitude (ML) is the commonly quoted earthquake magnitude originally defined by Richter. Because this measure of magnitude was originally defined from the amplitude measured on a specific type of seismograph at a specific distance (100 km) from an earthquake and for a specific region (California), empirical calibration curves must be used to convert seismograph information at an arbitrary distance in any given region to that expected at 100 kilometers from a California quake, for different types of seismographs.
For a given event, MB, MS, and ML are generally different. Approximate relationships between these three scales of earthquake magnitude have been deduced as follows:
MB = 1.7 + 0.8 ML - 0.01ML2
MB = 0.56 MS + 2.9
The importance of determining magnitude is that it permits earthquakes to be classified on the basis of the elastic energy released at the epicenter. The relationship between magnitude and energy released (E) is:
logE = 12.24 + 1.44 MS
Thus, a one-unit increase in magnitude implies a 30-fold increase in total elastic energy release!
See Idaho Geological Survey Staff Report 95-2, for information on how magnitude is determined from a seismograph trace.
B. Take a look at the map of Figure 6 which shows Idaho earthquake magnitudes measured by seismographs between 1935 and 1993. Turn off the appropriate layers to show earthquakes of greater than magnitude 3.5 but less than 4.5 (expressed as body wave magnitude, MB); of greater than magnitude 4.5 and less than 5; and of greater than magnitude 5. Magnitudes greater than 6 are shown as large symbols. Note that because body wave magnitude is reported, the maximum values for the largest events may be smaller than commonly reported as Ms.
Exercise #3:
Idaho Earthquakes
PRINT: Table 1, Table 2 & Figure 7, then complete the activities below.
1. From Figure 6, which county and which geologic province have had the most earthquakes? the fewest?
2. Excluding areas outside the state, where do most felt earthquakes (M>4) occur in Idaho?
3. Considering only earthquakes with magnitudes greater than 4.5, where do these occur relative to Holocene fault activity?
4. Three of the eight largest earthquakes occurred in the same locations so only five distinct symbols may be apparent for these in Figure 6. Four of the largest earthquakes occurred in central Idaho; where did the largest of these occur?
5. Create a graph of earthquake frequency from data on felt earthquakes collected over the past 110 years: Table 1lists Idaho earthquakes with surface wave magnitudes greater than 5 that have occurred between 1884 and 1994; in Table 2, enter the number of earthquakes having magnitudes greater than or equal to each value listed; plot these values against magnitude in a graph like that shown in Figure 7. As an example, the first and last two values have already been entered in Table 2and plotted in Figure 7.
6. Answer these questions based on your graph:
i) How many earthquakes with magnitude 5 or greater occurred between 1884 and 1994?
ii) The recurrence interval is the number of years in a period of time divided by the number of earthquakes of a certain magnitude or greater. Divide 110 years by the number of earthquakes having a magnitude greater than 5. What is the recurrence interval of Magnitude 5 earthquakes in Idaho?
iii) Repeat steps i) and ii) to find the recurrence interval for earthquakes of Magnitude 6 or greater.
iv) Repeat steps i) and ii) to find the recurrence interval for earthquakes of Magnitude 7 or greater.
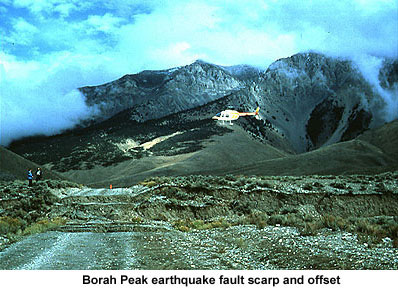
Exercise #4:
Borah Peak Earthquake Intensities
TAKE A LOOK at Idaho Geological Survey GeoNote 5 for a summary of information on the Borah Peak earthquake. GeoNotes on a variety of topics are available free of charge from the IGS Publications Office.
PRINT: Table 3, Table 4 & Figure 8 (.jpg version), then complete the activities below.
Another method of describing the size of an earthquake is through qualitative assessments of the effects of earthquake energy on buildings, people, and topography. This measure is known as the intensity ( IO) of an earthquake and is defined on the Modified Mercalli Scale shown in Table 3; it is possible to relate magnitude (MS) and the maximum intensity (IO) observed for a given earthquake as follows:
MS
= 1 + 2 IO/3
or IO = 3(MS - 1)/2
Near the epicenter, for example, moderate damage to buildings (IO= VII) can generally be expected during a magnitude 5.6 earthquake, and general destruction (IO= X) during a 7.6 event.
Use the information above and answer the following:
1. Table 4 lists descriptions of the maximum recorded intensities from the Borah Peak earthquake at various locations around the state; the locations of these measurements are shown in Figure 8. Note the large area over which intensities of VI or greater were observed; what sort of damage occurred at these intensities at these locations?
2. Using Table 3, assign a Modified Mercalli intensity value to each description in Table 4 and plot these earthquake intensity values on the Figure 8 map then draw contours to produce an Isoseismal Map. Such a map identifies areas of greatest damage which are usually near the epicenter where ground shaking is strongest. However, high intensities may also occur where ground shaking is amplified by geologic conditions, such as areas on sedimentary fill and lake deposits.
3. Answer these questions:
i) what was the maximum intensity felt at the Utah border?
ii) what was the maximum intensity at the Canadian border?
iii) why does intensity generally decrease at greater distances from the epicenter?
iv) why is the intensity near the Canadian border greater than at the Utah border, when Utah is much closer to the epicenter than Canada?
v) does the earthquake magnitude depend on distance from the epicenter? Would it make sense to ask what the magnitude of the Borah Peak earthquake was at the Canadian border? Explain.
4. For a visual animation of earthquakes in Idaho and around the world, download Seismic III software for earth science teachers.
Recommended Review Material
Chapter 2 of Rocks, Rails and Trails
Idaho Earthquakes Home Page
Groundwater Resources Home Page